Seven hundred and ten euros, and a three-figure effect
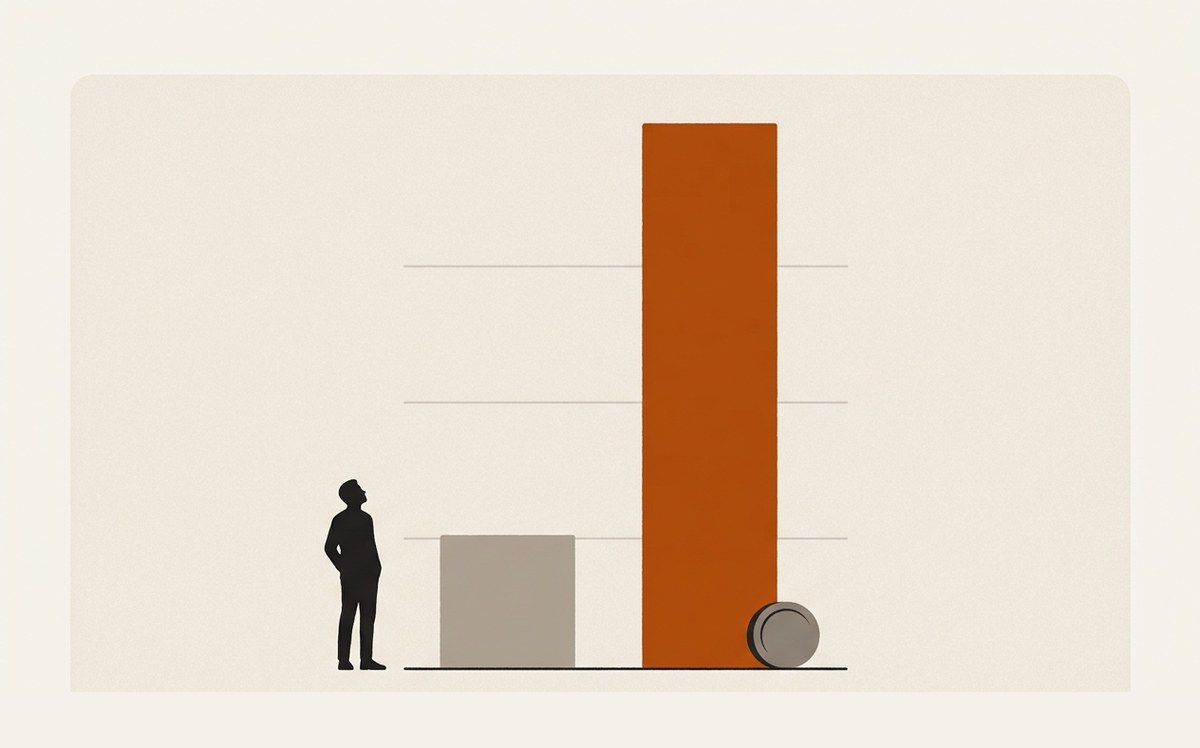
Most campaign reports compare a campaign to itself. This one compares a product page to what it was without a campaign, against the same month the previous year and against the previous month, on an isolated perimeter and a trivial budget.
The media buy: a three-figure budget over three weeks, for close to 600,000 impressions and a cost per click of 13 cents. The measured effect on the product page: +219% page views, +234% unique page views, average time on page rising from thirty-nine seconds to over a minute, and +415% social traffic to the site.
Across the whole site, unique visits rose 129% month on month, and the referral share of traffic went from 10% to 30%. It is the cleanest demonstration I know of the relationship between spend and effect, because the perimeter is small and everything in it is visible.
A home improvement retailer with two stores in an island market, a commercial catalogue that changes with every operation, and a website that acts as a shop window more than a shop. The account ran at a dense rhythm: site updated with every campaign, several hundred keywords bought, a monthly send, two social pages managed, game applications, and a monthly on-site visit. The system was installed, measured, and routine enough that a variation would show.
Proving a campaign's effect is almost always impossible, because everything moves at once: the season, the catalogue, the competition, organic traffic. Here two rare conditions came together. The perimeter was isolated, a clearance operation on one specific range, therefore one specific product page. And history existed, because the account had been measured for two years. Without those two conditions, a before-after report proves nothing, and you have to tell the client that rather than sell them a correlation.
1 · Week one: listen and decide.
On site. Understand what the cooperative does, what its buyers and partners need to believe, and what the members are proud of. Positioning written and validated in the room, not by email.
2 · Week two: build the identity.
Visual identity designed against the positioning: name system, marks, colours, typography, and rules simple enough to be applied without a design team. Every choice tested against one question: does this raise institutional trust?
3 · Week three: ship the assets.
The working kit the cooperative actually needed: documents, signage, presentation materials, templates. Delivered with a short guide and a working session so the members could produce their own materials next month.
4 · Spend where perception changes.
The budget went into the few physical touchpoints partners actually see. Nothing was spent on deliverables that flatter the consultant.
2013 and 2014 campaigns, isolated perimeter.
- A three-figure media buy over three weeks, close to 600,000 impressions, cost per click of 13 cents
- +219% page views and +234% unique page views on the product page concerned
- Average time on page from thirty-nine seconds to over a minute
- +415% social traffic to the site over the period
- +129% unique site visits month on month, referral share from 10% to 30%
- On the second store opening, cost per follower of 17 cents, the best in the portfolio
A tiny budget, well measured, is more convincing than a large one badly attributed. What makes this report solid is not the size of the effect, it is the size of the perimeter: small enough for the effect to be attributable, tracked enough for a variation to show. If you cannot isolate a perimeter, you are not measuring, you are narrating.
Can you isolate a perimeter and prove the effect?
The first call30 minutes. We talk about your traction and what is blocking it. You leave with 2 or 3 moves you can act on. No pitch.