The same system on three markets, three opposite results
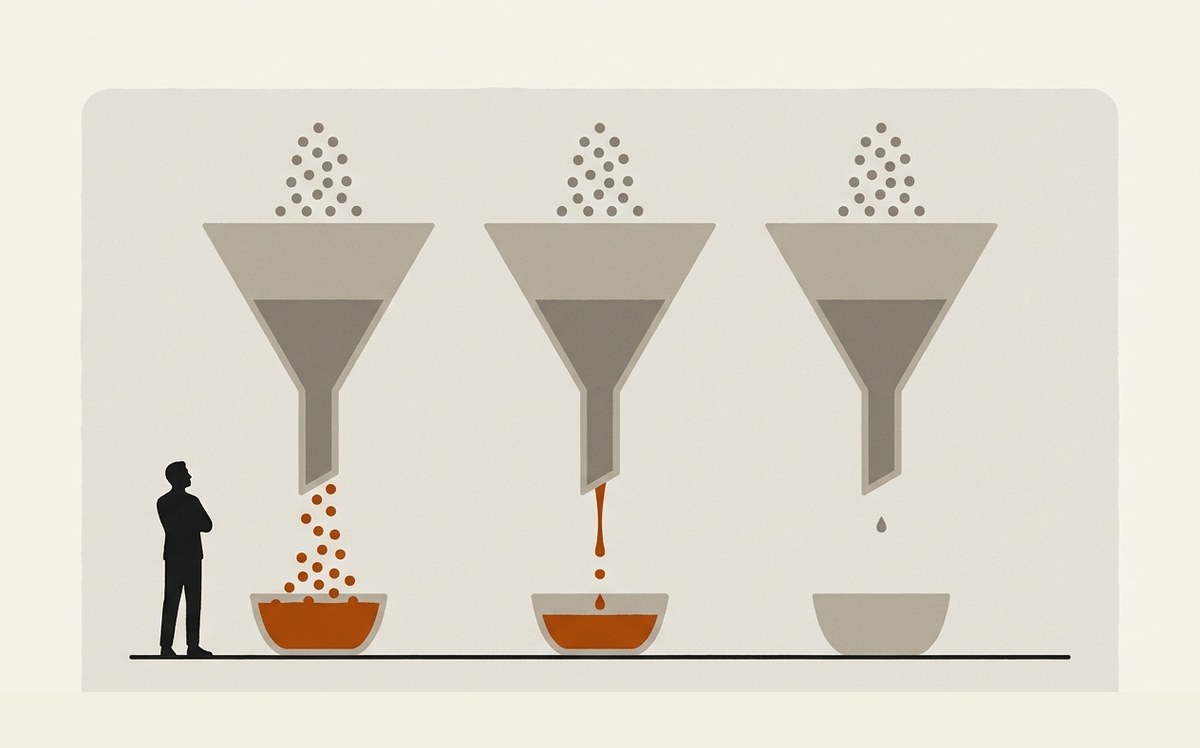
In 2023, at Bboxx, we opened a digital sales channel on three West African markets with exactly the same system: paid social, a lead capture form, a call centre callback. Same product, same method, same group team behind it.
First-half conversion: 6.24 percent on the first market, 5.51 percent on the second, 0.12 percent on the third. A factor of fifty between best and worst, on an identical system. And cost per lead was fine everywhere, between $0.85 and $2.36.
That is why this page exists. A channel is not judged on its entry metric. It is judged on fully loaded cost per sale, callback labour included, and that number tells a completely different story.
The group sold equipment on instalments through a commissioned field sales force, market by market. The digital channel was meant to open a second route: cheaper, faster to stand up, measurable end to end. The system was designed at group level and deployed identically, which was the right call. Without a common standard, comparing three markets means nothing.
A digital channel is not a channel, it is a chain. An ad, a form, a lead base, a call centre, a delivery team, stock. Marketing owns the first third. The rest belongs to local operations, and that is where the result is decided. Add that the three markets had neither the same commercial maturity, nor the same stock, nor the same number of tele-agents. The system was identical; the conditions were not.
1 · Week one: listen and decide.
On site. Understand what the cooperative does, what its buyers and partners need to believe, and what the members are proud of. Positioning written and validated in the room, not by email.
2 · Week two: build the identity.
Visual identity designed against the positioning: name system, marks, colours, typography, and rules simple enough to be applied without a design team. Every choice tested against one question: does this raise institutional trust?
3 · Week three: ship the assets.
The working kit the cooperative actually needed: documents, signage, presentation materials, templates. Delivered with a short guide and a working session so the members could produce their own materials next month.
4 · Spend where perception changes.
The budget went into the few physical touchpoints partners actually see. Nothing was spent on deliverables that flatter the consultant.
First half of 2023, three markets, one system.
- Conversion of 6.24%, 5.51% and 0.12% on the same system, three markets
- Cost per lead between $0.85 and $2.36 everywhere, including the failing market, which proves the entry metric says nothing about the outcome
- On the first market, the digital channel outsold the field force over six months, having existed for less than six
- Media budget halved on one market by tightening geography, with conversion up
- Pilot stopped on the third market, relaunched a year later after a rebuild, cost per lead down eightfold
- Group roadmap resequenced market by market: scale up, improve, full rebuild, hold
A low cost per lead is worth nothing if nobody picks up the phone. The only number that decides is fully loaded cost per sale, and it includes lines that do not belong to marketing: call centre time, stock availability, delivery capacity. If your paid channel is judged on cost per click, you do not yet know whether it works.
Is your paid channel judged on the right metric?
The first call30 minutes. We talk about your traction and what is blocking it. You leave with 2 or 3 moves you can act on. No pitch.